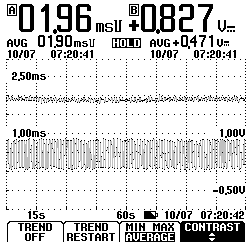
Plotting signal's

I thought this would be an interesting plot, this is injector on time, and o2 sensor volts over a period of two minutes. This is with the engine at operating temp, 2500rpm in the shop. The readings of the two signals can be shown minimum, average, or maximum.


In the next image, the engine was forced lean with a vacuum leak, (1st) and then made to go rich with propane (2nd). 95 Toyota PU 4cyl EFI 33k miles.
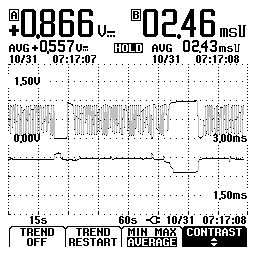
The next one is a simple intermittent misfire, (1st) then a dead misfire (2nd).
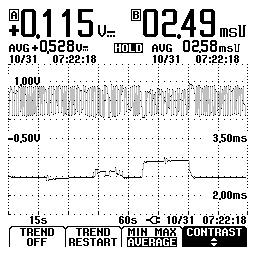
A good example of what you can do with signals on a labscope. Below are a few more.
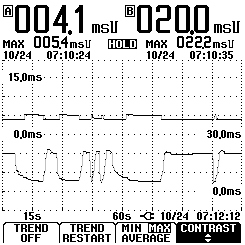
This is a plot of pip and spout, spout is the top trace, pip is the bottom trace. The scope is measuring pulse width of the negative on time of the signals. You can see the changes in pulse width as the engine rpm changes. This is with spout enabled.
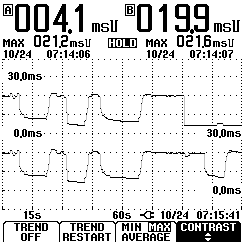
In this plot spout is disabled during the engine rpm changes, then towards the end spout was enabled. The traces are identical until spout was enabled again. Amazing what you can do with labscopes. These tests would be of good use in road testing.
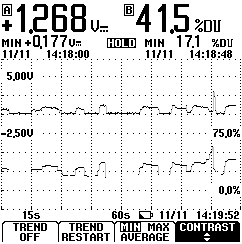
This next plot is from a 96 Ford Ranger 3.0 V6 74k miles. The top trace is the DPFE signal, the bottom trace is the signal to the EVR solenoid. This plot recorded before DPFE sensor replacement.
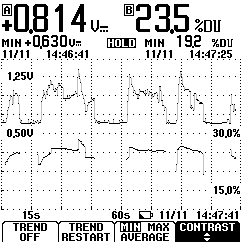
Here's the plot recorded after sensor was replaced, idle signal (min volts) is back where it should be and stayed consistent. Idle signal on bad sensor started out at .450v cold, and dropped to .177v hot. Internal seal on pressure sensing disc was leaking due to corrosion around sealing surface of sensor housing. Caused intermittent code. Positive pressure sends higher voltage to PCM allowing more EGR flow by adjusting duty cycle on EVR solenoid.
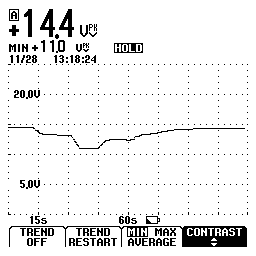
Here is a simple plot, scope hooked up to battery, engine at idle, then turned off, ignition disabled and engine cranked for a few seconds, ignition enabled and engine started again. The other channel could have an amp probe hooked up to see charging rate after a 15 second crank test. 1980 Olds Toronado 5.7 V8 207k Miles after starter replacement. Believe it or not, original starter.
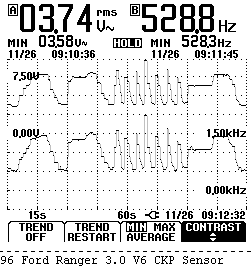
Crankshaft position sensor plot, lots of measurements here when using both channels on one signal.
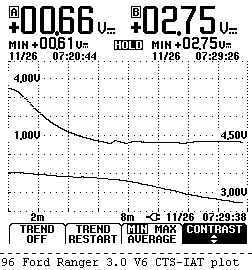
Coolant temp sensor, Intake air temp sensor plot.
Go here for a case study on a fuel pump problem.