More plotted signals

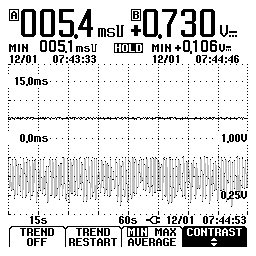
90 Ford 5.8 V8 Injector-O2 plot (min).
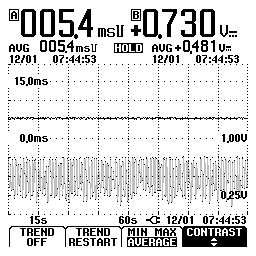
90 Ford 5.8 V8 Injector-O2 plot (avg).
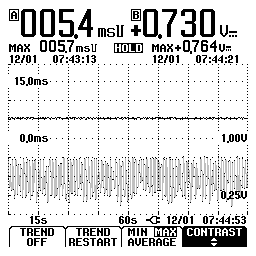
90 Ford 5.8 V8 Injector-O2 plot (max).
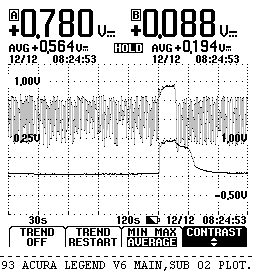
93 Acura Legend V6 main, sub o2 plot, (A) main, (B) sub (post cat) with propane added event, 2500 rpm engine at OT.
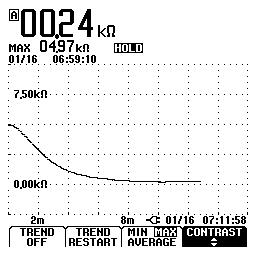
Coolant temp sensor resistance plot, another way to test CTS, connector to PCM unhooked.
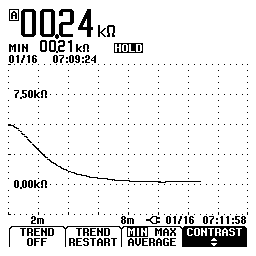
Resistance starts at almost 5k ohms, and slowly drops off as coolant warms to operating temp about 200 ohms. Thermostat opening is hardly seen here since the coolant in the radiator gets warmed from the heater core return line going directly to the radiator tank.
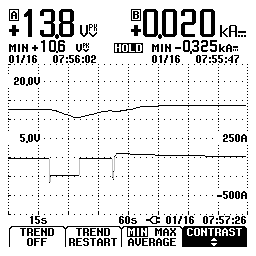
15 second cranking test, battery volts on (A) amps (Fluke 90i-610s probe) on (B). First downward spike on trace (B) is the starter being engaged, -325 amps just to start it turning. After the starter began turning, the amps leveled off to about -220 and stayed there for the full 15 seconds. The time from the end of the cranking test to the next spike is the time I spent hooking the coil back up.
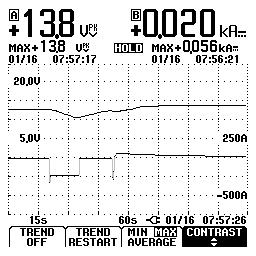
After restarting, the amps went to +56 showing the alternator doing its thing then slowly dropping off as the battery came back to life. Voltage level follows this by going up as amperage drops off. After getting the scope setup to do this the first time, its a lot easier doing the crank test with it versus hooking up the VAT or the big scope. And, you are load testing the battery as well. I love it!!!
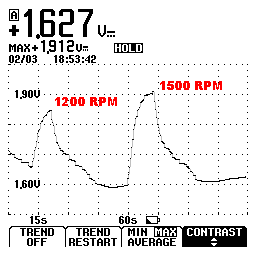
97 Ford Ranger 3.0L V6 Purge Flow Sensor Trendplot, Indicates actual amount of flow through Evap Solenoid to Evap Canister. Controls 5V Reference input to PCM based on amount of flow.