Viewing CTS - IAT Sensor's
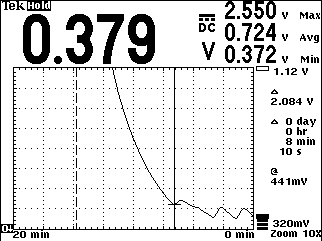
Here is a CTS plot over a fifteen minute period, the cold engine volts begins at 2.5v,and slowly drops as the coolant begins to heat up. This plot done on the meter portion of my Tekscope.

If we magnify the graph, we see the detail in the plot, the long leg downward shows a nice steady drop with no transients along the way, just a nice curve. Also, this is the time it took to reach thermostat opening, about 8min with the engine at 1800rpm in the shop. The voltage took an upswing at 441mv, then started back down.

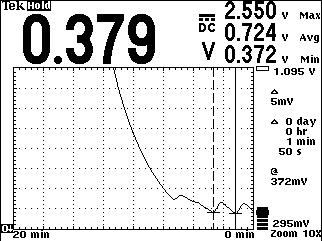
Here is the time it took from thermostat opening to engine cooling fan on temp, about three min.

After the fan comes on, in this case at 370mv, it takes an upswing a few seconds after its been on, then continues upward after the fan shuts off, fan is on for about 50sec.

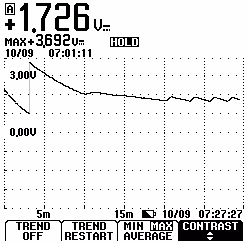
Here is a plot from a 90 Buick Skylark 3.3 V6 with the fallback sensor. You can see where it goes back to a lower resistance allowing more voltage to be seen on the return line to the PCM. Then you can see thermostat opening, then cooling fan operation. Twenty six minute plot, 1800rpm in shop. My Fluke 123 does a more detailed plot.

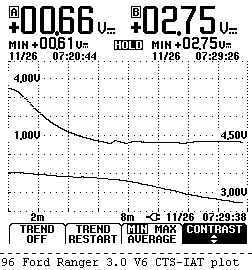
Here's a plot of CTS and IAT, 96 Ford Ranger 3.0 V6, you can see thermostat opening in the top trace between the 6 to 8 minute time frame. IAT drops off somewhat as engine warms to operating temp. Both sensors start out at 3.5v on a cold engine.